
Hi everyone,
Members of the Fish Passage Action Team have developed a CFD template specifically for looking at fish passage.
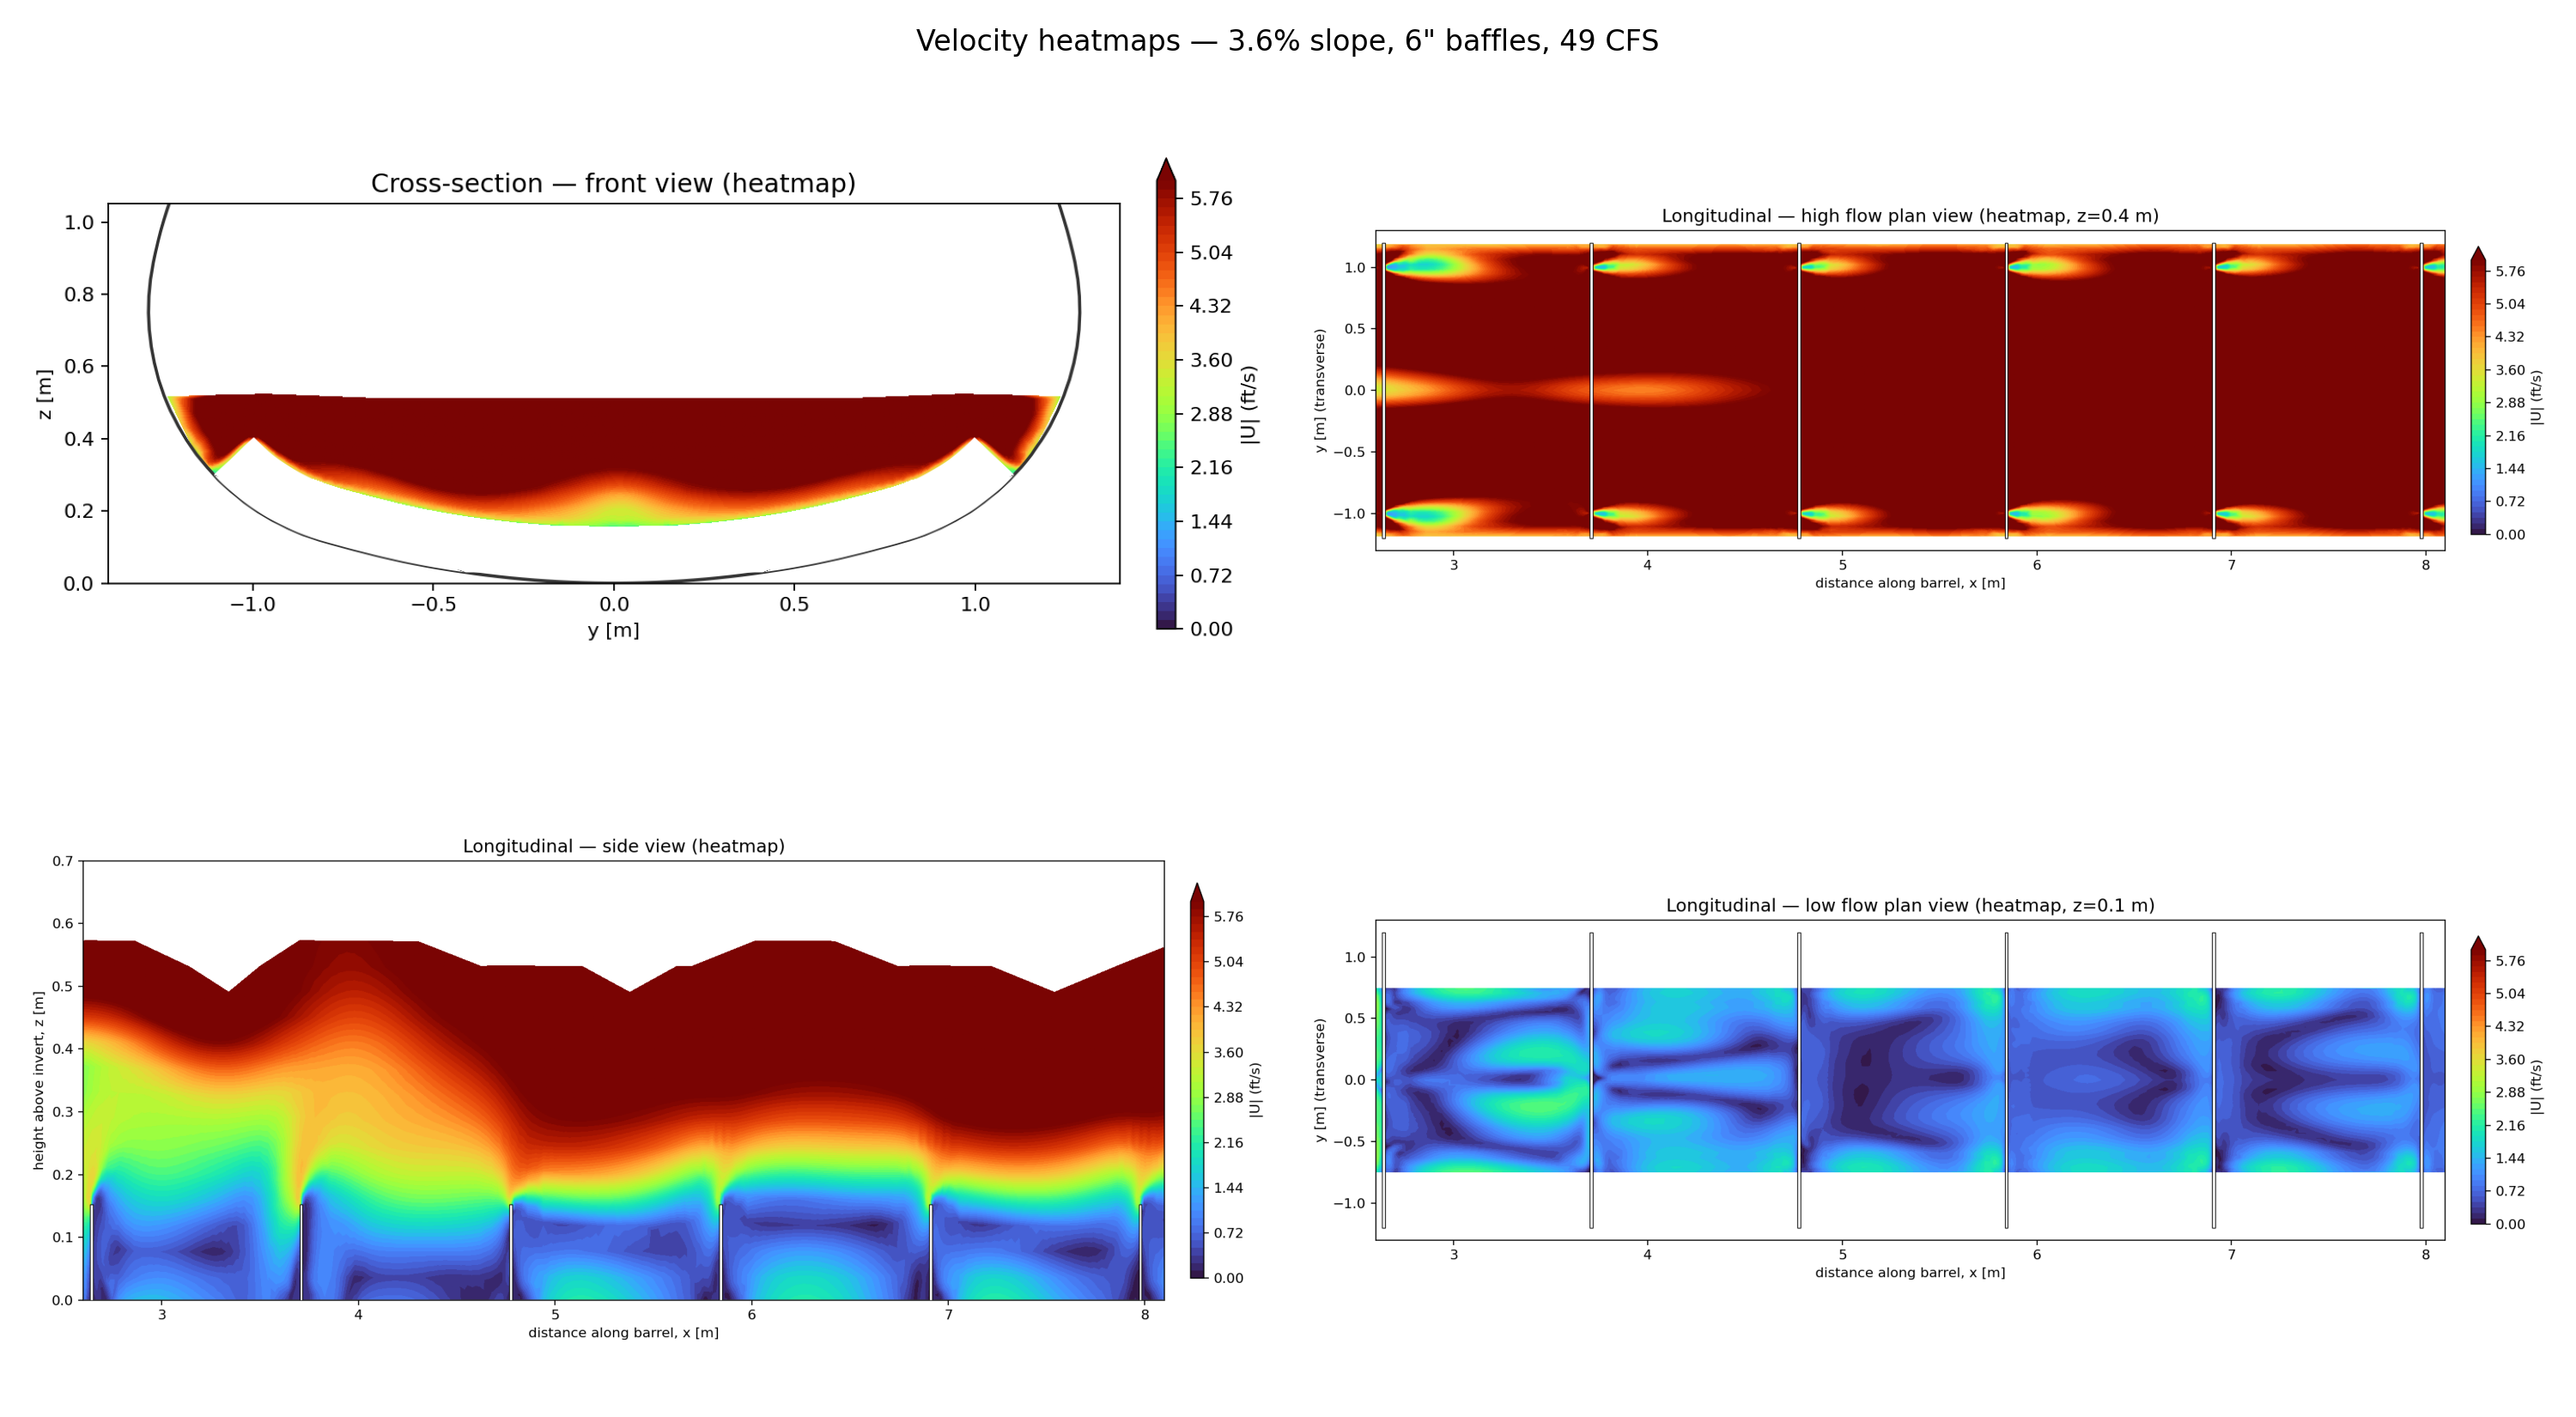
Digital modelling lets us look below the surface, at what a single “average velocity” figure never shows.
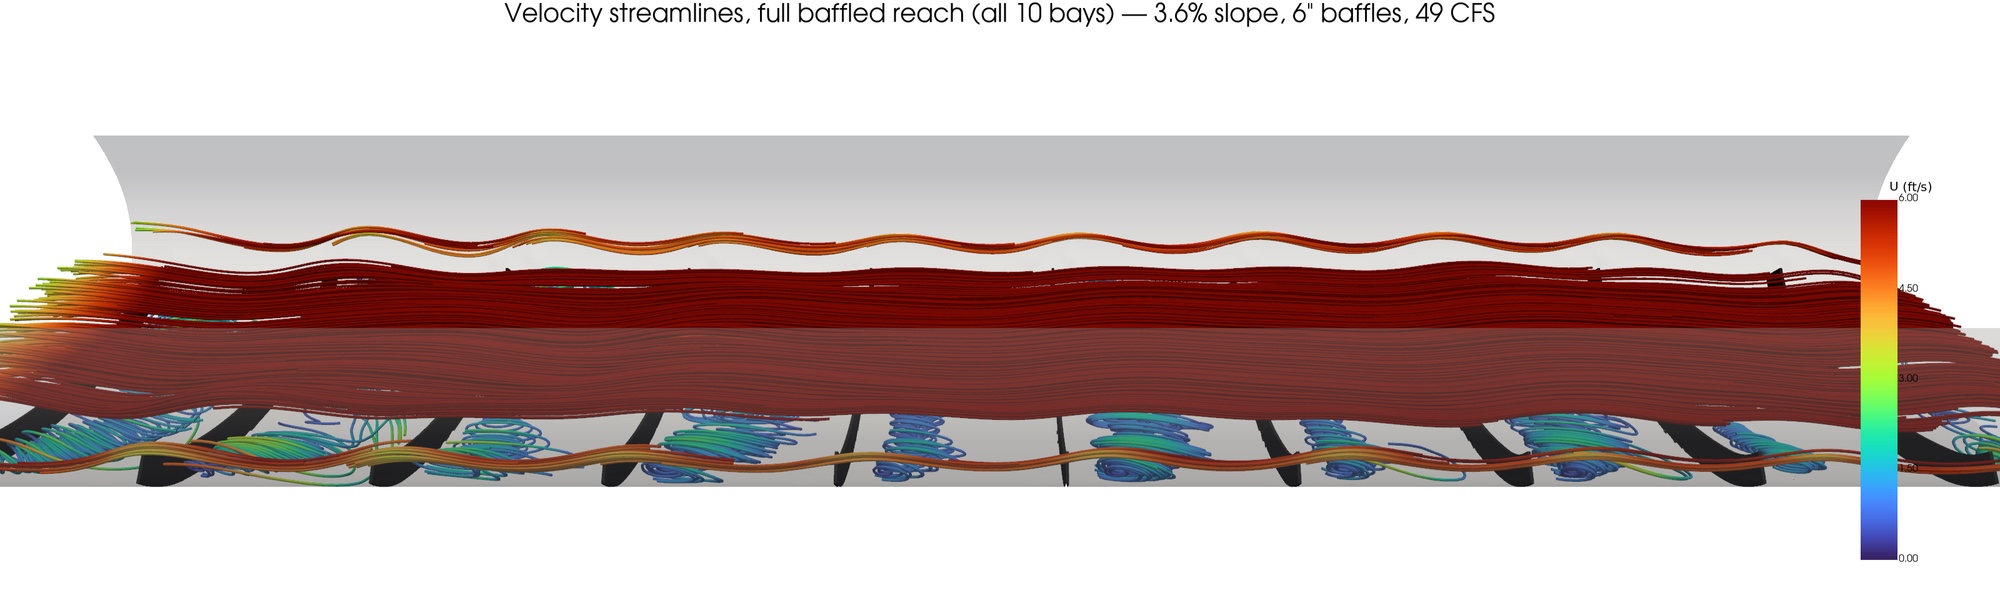
The surface flow can look far too fast. But look underneath and you find low-velocity zones and resting pools sitting between the baffles. Those are the routes fish use to move upstream. Even at a high flow of 49 CFS / 1.4 m³/s, the velocities through them stay within the range fish can hold and swim against, including weaker swimmers and juveniles.
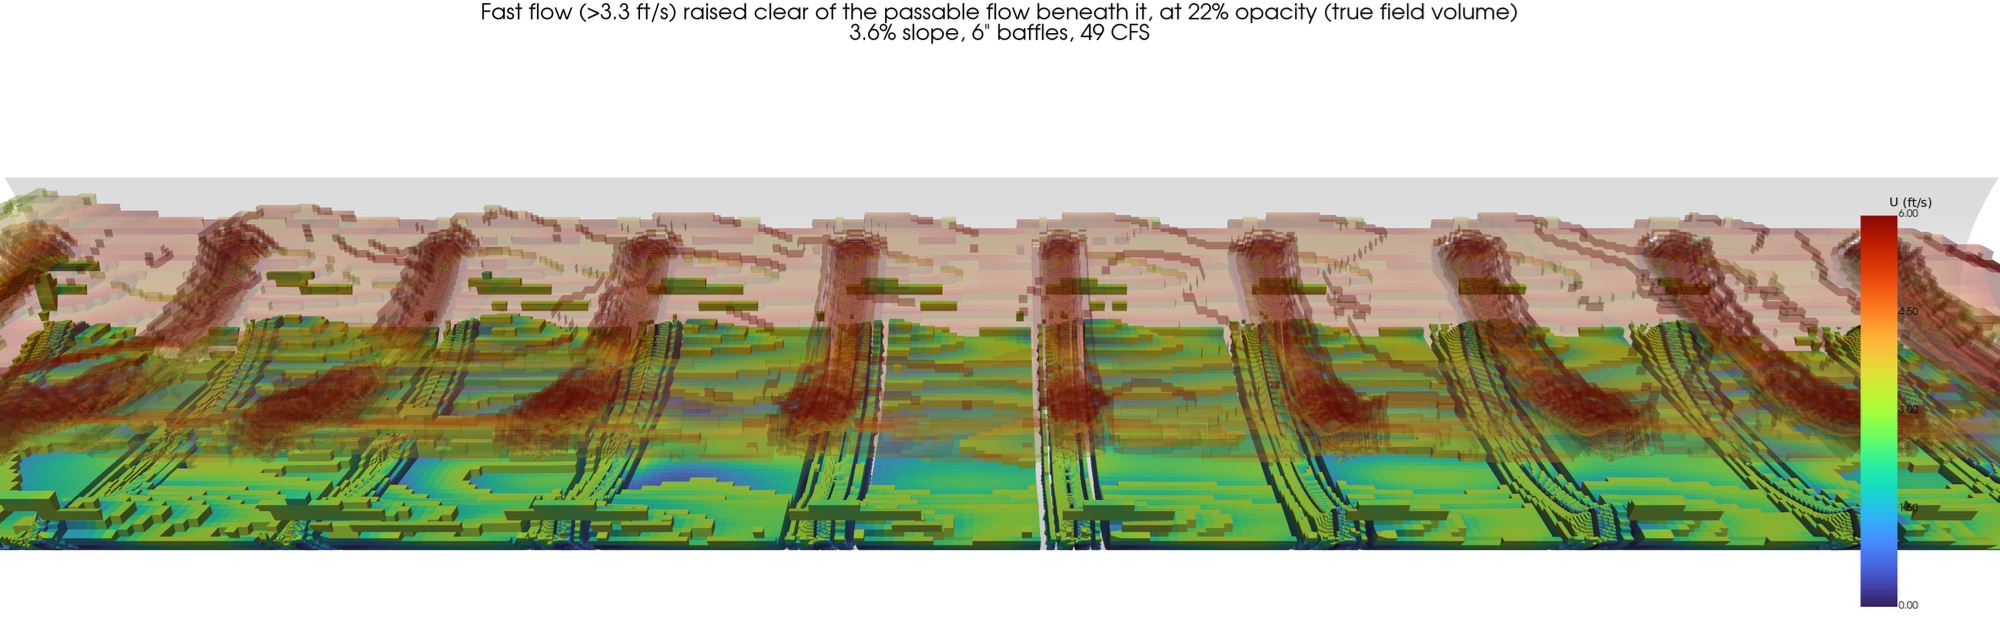 As flow increases, the surface velocity rises and drags the average up with it – but the sheltered zones below can stay slow enough to remain passable. A single averaged number mixes the fast surface and the slow refuge together, so you lose sight of the passage that’s actually there.
This is where traditional 1D methods fall short. Anyone who’s used HY-8 knows it doesn’t handle baffled culverts well – it can’t resolve the recirculation, the resting pools, or the low-velocity corridors that decide whether a fish gets through.
Whatever passage standard applies in your region, the value of seeing the flow in three dimensions is the same: you assess the culvert against the swim speeds that matter for your target species, not a single blended average.
If you’d like to know more, or have a project you’d like us to simulate, contact the FPAT directly.